
The journey to learning a new topic is always the most difficult at the beginning. We aim to make it a lot easier for you with this glossary.
You can find the terms which start with A-C and D-F .
G
Gap: The price difference between the previous session’s close and the current session’s open. This is usually seen on the daily time frame.
A gap up means the opening price is greater than the previous session’s closing price.
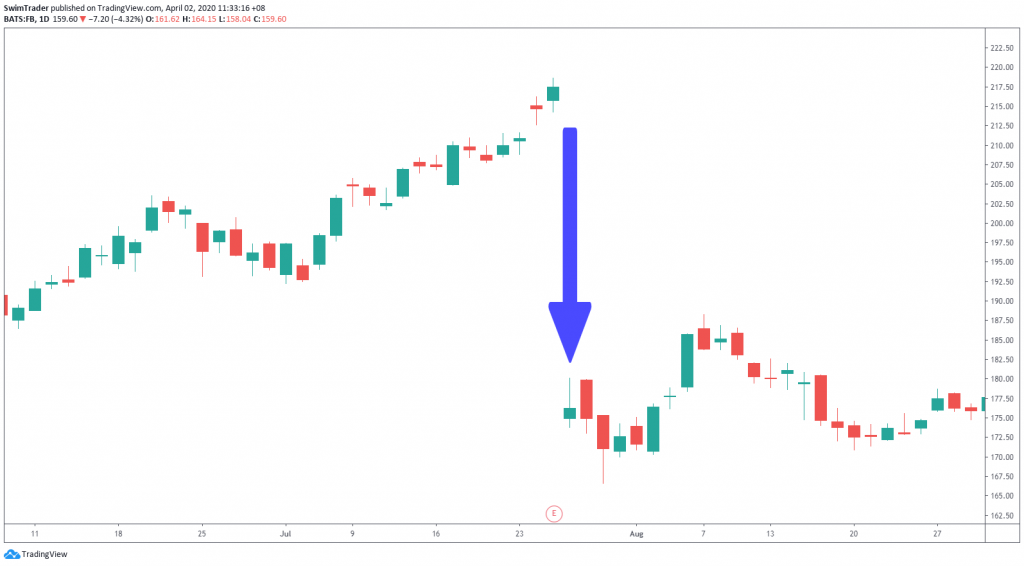
A gap down means the opening price is less than the previous session’s closing price.
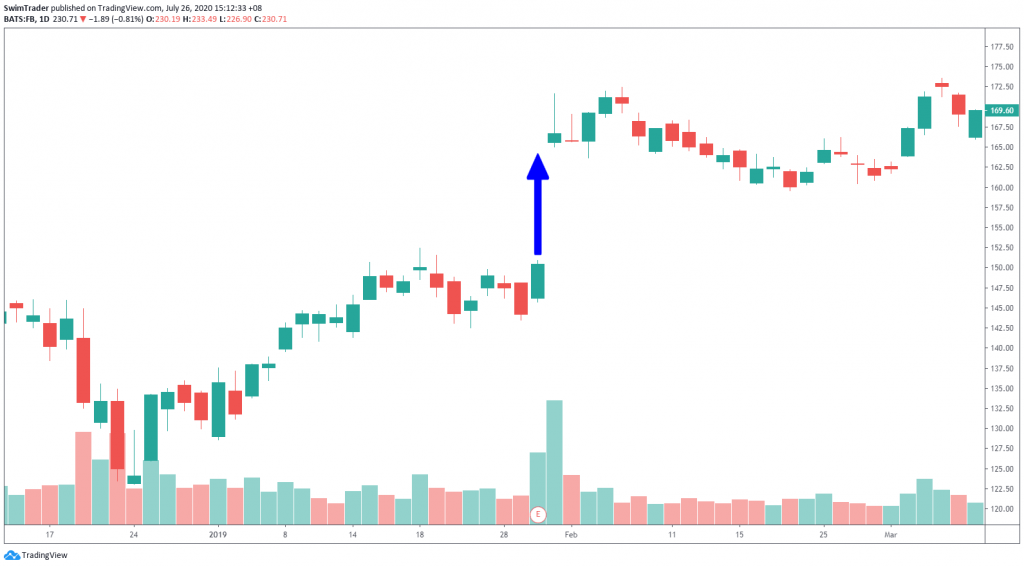
Above: A gap up from the chart of Facebook
Below: A gap down from the chart of Facebook
Geopolitics: International or regional political issues.
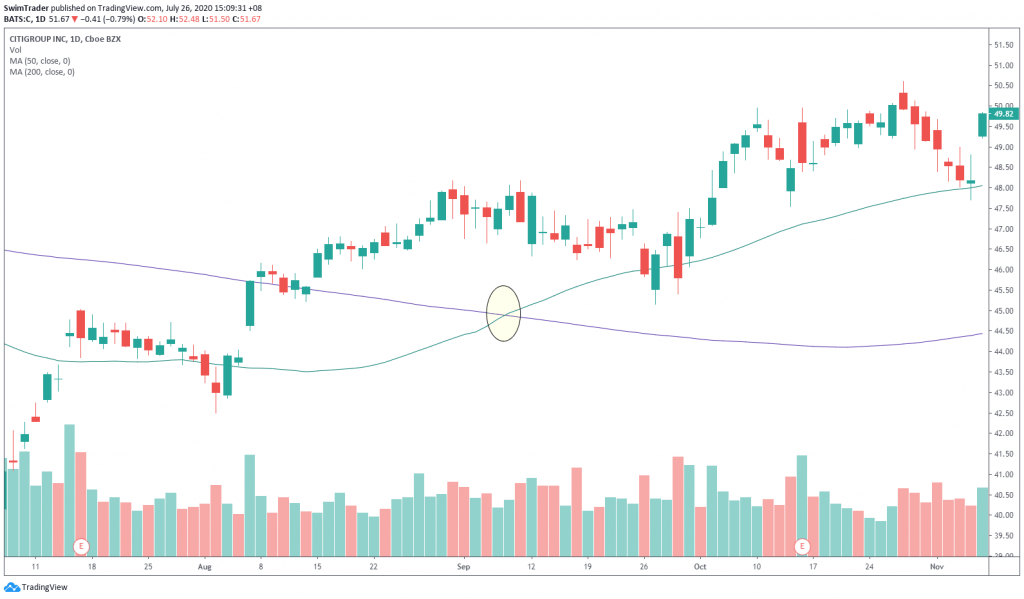
Golden cross: A bullish signal where the 50 day simple moving average (SMA) crosses above the 200 day SMA.
Eg. A golden cross formed on the chart of Citigroup (see the circled area).
The 50 day SMA is depicted in green while the 200 day SMA is shown in purple.
Good till canceled (GTC): A buy or sell order that is good until the position gets filled or canceled by the trader.
H
High frequency trading (HFT): Computerized trading that executes very fast through algorithms.
Higher time frame: A chart where each candle represents a longer period of time.
Eg. Weekly charts are of a higher time frame than daily charts.
I
Index: A group of financial assets that are used to be a performance indicator of a particular sector or economy.
Initial public offering (IPO): The first sale of a company’s stock to the public. This is also known as “going public”.
Invest: The outlay of capital in search for a financial return.
L
Limit order: An instruction set by the trader to buy or sell a stock at or below a specified price.
Liquidity: The ease of purchasing and selling of a security.
A stock which is liquid can be bought and sold easily, given that there is strong demand and supply.
A stock which is illiquid may take a longer time to be bought and sold as the is little demand and supply.
Long: The purchase of a stock, in anticipation of a price increase.
Lower time frame: A chart where each candle represents a shorter period of time.
Eg. Weekly charts are of a lower time frame than monthly charts.
We are halfway to completing this glossary! Bookmark this site for more articles.
Here’s What You Can Do To Improve Your Trading Right Now:
#1 Register for our market outlook webinars by clicking here
#2 Join us in our Facebook Group as we can discuss the various ways of applying this by clicking here
#3 Never miss another market update; get it delivered to you via Telegram by clicking here
#4 Grab a front row seat and discover how you can expand your trading arsenal in our FREE courses (for a limited time only) by clicking here
See you around!
